

Chart.js is an open-source HTML chart for your website. In this tutorial, I am going to show chart.js integrates into the angular projects.
Road Map…
- Setup angular new project from scratch
- Add bootstrap ui Library (optional)
- Implement chart with pure chart.js library
- Implement chart with angular base package ng2-charts
Let’s setup new angular project
Generate angular project
Make sure your machine has angular CLI and my suggestion is always to use the angular latest version for new projects
ng new angular-chart
cd angular-chart
Add bootstrap UI library (optional)
I am going to add the bootstrap library to represent UI a little bit pretty
npm i bootstrap --save
In the angular.json file add the bootstrap CSS file of the styles section
        // ...
        "build": {
            // ...
            "styles": [
              "node_modules/bootstrap/scss/bootstrap.scss",
              "src/styles.scss"
            ],
            "scripts": []
          },
        // ...
        }
        // ...
Implement chart with pure chart.js
To implement chart via only chart.js library make sure you install the latest chart.js package.
Add chart dependancy
npm i chart.js --save
Implement chart data
In the app.component.ts file, fetch chart data. In this example: I am going to use static data
Note: Make sure where you going to the initial chart. make sure you register the chart in a contractor.
example to register: Chart.register(…registerables);
import { Component } from '@angular/core';
import { Chart, registerables } from 'chart.js';

@Component({
  selector: 'app-root',
  templateUrl: './app.component.html',
  styleUrls: ['./app.component.scss']
})
export class AppComponent {
  title = 'angular-chart';
  constructor() {
    Chart.register(...registerables);
  }
  ngOnInit(): void {
    // Line Chart
    const lineCanvasEle: any = document.getElementById('line_chart')
    const lineChar = new Chart(lineCanvasEle.getContext('2d'), {
      type: 'line',
        data: {
          labels: ['January', 'February', 'March', 'April', 'May', 'June', 'July'],
          datasets: [
            { data: [12, 15, 18, 14, 11, 19, 12], label: 'Orders', borderColor: 'rgba(54, 162, 235)' },
            { data: [65, 59, 80, 81, 56, 55, 40], label: 'Sales', borderColor: 'rgb(75, 192, 192)' },
          ],
        },
        options: {
          responsive: true,
          scales: {
              y: {
                  beginAtZero: true
              }
          }
        }
      });
    // Bar chart
    const barCanvasEle: any = document.getElementById('bar_chart')
    const barChart = new Chart(barCanvasEle.getContext('2d'), {
      type: 'bar',
        data: {
          labels: ['January', 'February', 'March', 'April', 'May', 'June', 'July'],
          datasets: [{
            label: 'Sales',
            data: [65, 59, 80, 81, 56, 55, 40],
            backgroundColor: [
              'rgba(255, 99, 132, 0.2)',
              'rgba(255, 159, 64, 0.2)',
              'rgba(255, 205, 86, 0.2)',
              'rgba(75, 192, 192, 0.2)',
              'rgba(54, 162, 235, 0.2)',
              'rgba(153, 102, 255, 0.2)',
              'rgba(201, 203, 207, 0.2)'
            ],
            borderColor: [
              'rgb(255, 99, 132)',
              'rgb(255, 159, 64)',
              'rgb(255, 205, 86)',
              'rgb(75, 192, 192)',
              'rgb(54, 162, 235)',
              'rgb(153, 102, 255)',
              'rgb(201, 203, 207)'
            ],
            borderWidth: 1
          }]
        },
        options: {
          responsive: true,
          scales: {
              y: {
                  beginAtZero: true
              }
          }
        }
      });
  }
}
Implement chart in HTML
Edit app.component.ts file.
<div class="container py-5">
  <div class="row">
    <div class="col-4">
      <canvas id="line_chart" width="400px" height="400px"></canvas>
      <h3 class="text-center mt-3">Line Chart</h3>
    </div>
    <div class="col-4">
      <canvas id="bar_chart" width="400px" height="400px"></canvas>
      <h3 class="text-center mt-3">Bar Chart</h3>
    </div>
  </div>
</div>
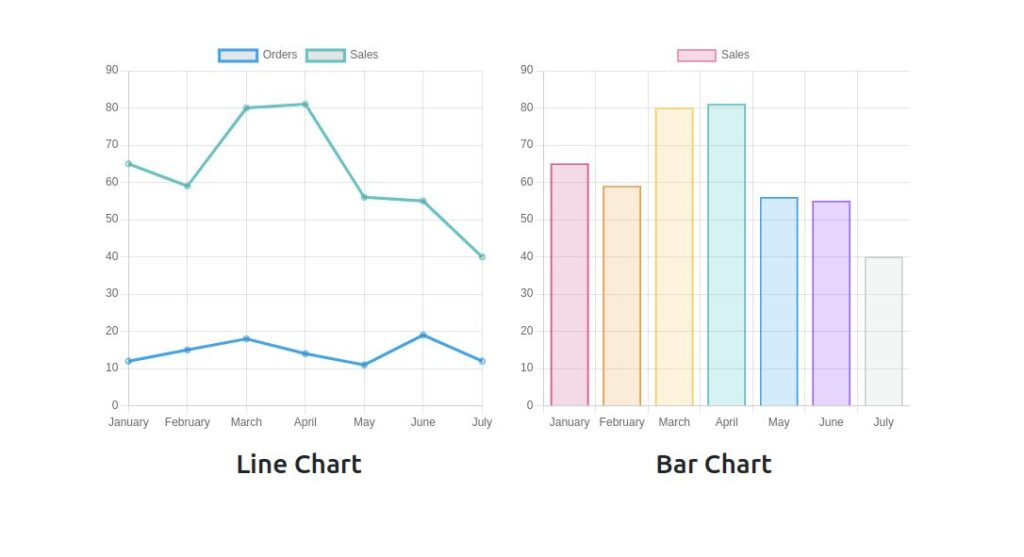
Pure chart.js chart preview
Implement chart via ng2-charts library
Add ng2-chart dependency
If you have already a chart.js dependency and chart.js version is not sustainable with the ng2-charts package. you will get an error for install. To solve chart.js install remove chart.js package first
npm install ng2-charts
Import ChartModule
In the app.module.ts file add ChartModule
import { NgModule } from '@angular/core';
import { BrowserModule } from '@angular/platform-browser';
import { ChartsModule } from 'ng2-charts';

import { AppRoutingModule } from './app-routing.module';
import { AppComponent } from './app.component';

@NgModule({
  declarations: [
    AppComponent,
  ],
  imports: [
    BrowserModule,
    AppRoutingModule,
    ChartsModule,
  ],
  providers: [],
  bootstrap: [AppComponent]
})
export class AppModule { }
Generate different type of chart component
ng g c line-chart
ng g c pie-chart
ng g c bar-chart
ng g c doughnut-chart
ng g c polar-chart
ng g c rader-chart
ng g c bubble-chart
ng g c scatter-chart
Route all type chart component
import { NgModule } from '@angular/core';
import { RouterModule, Routes } from '@angular/router';
import { BarChartComponent } from './bar-chart/bar-chart.component';
import { BubbleChartComponent } from './bubble-chart/bubble-chart.component';
import { DoughnutChartComponent } from './doughnut-chart/doughnut-chart.component';
import { LineChartComponent } from './line-chart/line-chart.component';
import { PieChartComponent } from './pie-chart/pie-chart.component';
import { PolarChartComponent } from './polar-chart/polar-chart.component';
import { RadarChartComponent } from './radar-chart/radar-chart.component';
import { ScatterChartComponent } from './scatter-chart/scatter-chart.component';

const routes: Routes = [
  {
    path: 'line-chart',
    component: LineChartComponent
  },
  {
    path: 'pie-chart',
    component: PieChartComponent
  },
  {
    path: 'bar-chart',
    component: BarChartComponent
  },
  {
    path: 'doughnut-chart',
    component: DoughnutChartComponent
  },
  {
    path: 'polar-chart',
    component: PolarChartComponent
  },
  {
    path: 'radar-chart',
    component: RadarChartComponent
  },
  {
    path: 'bubble-chart',
    component: BubbleChartComponent
  },
  {
    path: 'scatter-chart',
    component: ScatterChartComponent
  },
  {
    path: '',
    pathMatch: 'full',
    redirectTo: 'line-chart'
  }
];

@NgModule({
  imports: [RouterModule.forRoot(routes)],
  exports: [RouterModule]
})
export class AppRoutingModule { }
Edit app.components.html
Add router outlet and navbar in App component
<nav class="navbar navbar-expand-lg navbar-dark bg-primary py-3 mb-5">
  <div class="container">
    <a class="navbar-brand" href="#">Angular Charts</a>
    <button class="navbar-toggler" type="button" data-bs-toggle="collapse" data-bs-target="#navbarSupportedContent" aria-controls="navbarSupportedContent" aria-expanded="false" aria-label="Toggle navigation">
      <span class="navbar-toggler-icon"></span>
    </button>
    <div class="collapse navbar-collapse" id="navbarSupportedContent">
      <ul class="navbar-nav ms-auto mb-2 mb-lg-0">
        <li class="nav-item">
          <a class="nav-link" routerLink="line-chart" routerLinkActive="active">Line Chart</a>
        </li>
        <li class="nav-item">
          <a class="nav-link" routerLink="pie-chart" routerLinkActive="active">Pie Chart</a>
        </li>
        <li class="nav-item">
          <a class="nav-link" routerLink="bar-chart" routerLinkActive="active">Bar Chart</a>
        </li>
        <li class="nav-item">
          <a class="nav-link" routerLink="doughnut-chart" routerLinkActive="active">Doughnut Chart</a>
        </li>
        <li class="nav-item">
          <a class="nav-link" routerLink="polar-chart" routerLinkActive="active">Polar Chart</a>
        </li>
        <li class="nav-item">
          <a class="nav-link" routerLink="radar-chart" routerLinkActive="active">Radar Chart</a>
        </li>
        <li class="nav-item">
          <a class="nav-link" routerLink="bubble-chart" routerLinkActive="active">Bubble Chart</a>
        </li>
        <li class="nav-item">
          <a class="nav-link" routerLink="scatter-chart" routerLinkActive="active">Scatter Chart</a>
        </li>
      </ul>
    </div>
  </div>
</nav>

<div class="container">
  <router-outlet></router-outlet>
</div>
Implement charts via ng2-charts
Line chart example
01 . Edit the line-chart.component.ts file and implement chart data
import { Component, OnInit } from '@angular/core';
import { ChartDataSets } from 'chart.js';
import { Color, Label } from 'ng2-charts';

@Component({
  selector: 'app-line-chart',
  templateUrl: './line-chart.component.html',
  styleUrls: ['./line-chart.component.scss']
})
export class LineChartComponent implements OnInit {
  lineChartData: ChartDataSets[] = [{ data: [65, 59, 80, 81, 56, 55, 40], label: 'Series A' },];
  lineChartLabels: Label[] = ['January', 'February', 'March', 'April', 'May', 'June', 'July'];
  lineChartOptions = {
    responsive: true,
  };
  lineChartColors: Color[] = [
    {
      borderColor: 'black',
      backgroundColor: 'rgba(255,0,0,0.3)',
    },
  ];
  lineChartLegend = true;
  lineChartType: string = 'line';
  lineChartPlugins = [];
  chart: any;
  constructor() { }

  ngOnInit(): void { }
}
02. Edit the line-chart.component.html file, and implement chart HTTP code
<div class="row">
  <div class="col-6 offset-3">
    <canvas baseChart width="400" height="400"
      [datasets]="lineChartData"
      [labels]="lineChartLabels"
      [options]="lineChartOptions"
      [colors]="lineChartColors"
      [legend]="lineChartLegend"
      [chartType]="'line'"
      [plugins]="lineChartPlugins">
    </canvas>
    <h3 class="text-center mt-3">Line Chart</h3>
  </div>
</div>
Pie chart example
01 . Edit the pie-chart.component.ts file and implement chart data
import { Component, OnInit } from '@angular/core';
import { ChartType, ChartOptions } from 'chart.js';
import { SingleDataSet, Label, monkeyPatchChartJsLegend, monkeyPatchChartJsTooltip } from 'ng2-charts';

@Component({
  selector: 'app-pie-chart',
  templateUrl: './pie-chart.component.html',
  styleUrls: ['./pie-chart.component.scss']
})
export class PieChartComponent implements OnInit {
  pieChartOptions: ChartOptions = {
    responsive: true,
  };
  pieChartLabels: Label[] = [['Download', 'Sales'], ['In', 'Store', 'Sales'], 'Mail Sales'];
  pieChartData: SingleDataSet = [300, 500, 100];
  pieChartType: ChartType = 'pie';
  pieChartLegend = true;
  pieChartPlugins = [];

  constructor() {
    monkeyPatchChartJsTooltip();
    monkeyPatchChartJsLegend();
  }

  ngOnInit() {
  }
}
02. edit the pie-chart.component.html file. implement chart HTML
<div class="row">
  <div class="col-8 offset-2">
    <canvas baseChart
      [data]="pieChartData"
      [labels]="pieChartLabels"
      [chartType]="pieChartType"
      [options]="pieChartOptions"
      [plugins]="pieChartPlugins"
      [legend]="pieChartLegend">
    </canvas>
    <h3 class="text-center mt-3">Pie Chart</h3>
  </div>
</div>
Bar chart example
01 . Edit the bar-chart.component.ts file and implement chart data
import { Component, OnInit } from '@angular/core';
import { ChartOptions, ChartType, ChartDataSets } from 'chart.js';
import { Label } from 'ng2-charts';

@Component({
  selector: 'app-bar-chart',
  templateUrl: './bar-chart.component.html',
  styleUrls: ['./bar-chart.component.scss']
})
export class BarChartComponent implements OnInit {
  barChartOptions: ChartOptions = {
    responsive: true,
  };
  barChartLabels: Label[] = ['2006', '2007', '2008', '2009', '2010', '2011', '2012'];
  barChartType: ChartType = 'bar';
  barChartLegend = true;
  barChartPlugins = [];

  barChartData: ChartDataSets[] = [
    { data: [65, 59, 80, 81, 56, 55, 40], label: 'Series A' },
    { data: [28, 48, 40, 19, 86, 27, 90], label: 'Series B' }
  ];

  constructor() { }
  ngOnInit() { }
}
02. edit the bar-chart.component.html file and implement chart data
<div class="row">
  <div class="col-6 offset-3">
    <canvas baseChart
      [datasets]="barChartData"
      [labels]="barChartLabels"
      [options]="barChartOptions"
      [plugins]="barChartPlugins"
      [legend]="barChartLegend"
      [chartType]="barChartType">
    </canvas>
    <h3 class="text-center mt-3">Bar Chart</h3>
  </div>
</div>
Doughnut chart example
01 . Edit the doughnut-chart.component.ts file and implement chart data
import { Component, OnInit } from '@angular/core';
import { Label, MultiDataSet } from 'ng2-charts';
import { ChartType } from 'chart.js';

@Component({
  selector: 'app-doughnut-chart',
  templateUrl: './doughnut-chart.component.html',
  styleUrls: ['./doughnut-chart.component.scss']
})
export class DoughnutChartComponent implements OnInit {
  doughnutChartLabels: Label[] = ['Download Sales', 'In-Store Sales', 'Mail-Order Sales'];
  doughnutChartData: MultiDataSet = [
    [350, 450, 100],
    [50, 150, 120],
    [250, 130, 70],
  ];
  doughnutChartType: ChartType = 'doughnut';
  constructor() { }

  ngOnInit(): void {
  }
}
02. edit the doughnut-chart.component.html file and implement chart data
<div class="row">
  <div class="col-6 offset-3">
    <canvas baseChart
      [data]="doughnutChartData"
      [labels]="doughnutChartLabels"
      [chartType]="doughnutChartType">
    </canvas>
    <h3 class="text-center mt-3">Doughnut Chart</h3>
  </div>
</div>
Polar Chart example
01 . Edit the polar-chart.component.ts file and implement chart data
import { Component, OnInit } from '@angular/core';
import { SingleDataSet, Label } from 'ng2-charts';
import { ChartType } from 'chart.js';

@Component({
  selector: 'app-polar-chart',
  templateUrl: './polar-chart.component.html',
  styleUrls: ['./polar-chart.component.scss']
})
export class PolarChartComponent implements OnInit {
  polarAreaChartLabels: Label[] = ['Download Sales', 'In-Store Sales', 'Mail Sales', 'Telesales', 'Corporate Sales'];
  polarAreaChartData: SingleDataSet = [300, 500, 100, 40, 120];
  polarAreaLegend = true;
  polarAreaChartType: ChartType = 'polarArea';
  // events
  chartClicked({ event, active }: { event: MouseEvent, active: {}[] }): void {
    console.log(event, active);
  }

  chartHovered({ event, active }: { event: MouseEvent, active: {}[] }): void {
    console.log(event, active);
  }
  constructor() { }

  ngOnInit(): void { }
}
02. edit the polar-chart.component.html file and implement chart data
<div class="row">
  <div class="col-6 offset-3">
    <canvas baseChart
      [data]="polarAreaChartData"
      [labels]="polarAreaChartLabels"
      [legend]="polarAreaLegend"
      [chartType]="polarAreaChartType">
    </canvas>
    <h3 class="text-center mt-3">Polar Chart</h3>
  </div>
</div>
Radar Chart example
01 . Edit the radar-chart.component.ts file and implement chart data
import { Component, OnInit } from '@angular/core';
import { ChartDataSets, ChartType, RadialChartOptions } from 'chart.js';
import { Label } from 'ng2-charts';

@Component({
  selector: 'app-radar-chart',
  templateUrl: './radar-chart.component.html',
  styleUrls: ['./radar-chart.component.scss']
})
export class RadarChartComponent implements OnInit {
  radarChartOptions: RadialChartOptions = {
    responsive: true,
  };
  radarChartLabels: Label[] = ['Eating', 'Drinking', 'Sleeping', 'Designing', 'Coding', 'Cycling', 'Running'];

  radarChartData: ChartDataSets[] = [
    { data: [65, 59, 90, 81, 56, 55, 40], label: 'Series A' },
    { data: [28, 48, 40, 19, 96, 27, 100], label: 'Series B' }
  ];
  radarChartType: ChartType = 'radar';
  constructor() { }

  ngOnInit(): void { }
}
02. edit the radar-chart.component.html file and implement chart data
<div class="row">
  <div class="col-6 offset-3">
    <canvas baseChart
      [datasets]="radarChartData"
      [options]="radarChartOptions"
      [labels]="radarChartLabels"
      [chartType]="radarChartType">
    </canvas>
    <h3 class="text-center mt-3">Radar Chart</h3>
  </div>
</div>
Bubble Chart example
01 . Edit the bubble-chart.component.ts file and implement chart data
import { Component, OnInit } from '@angular/core';
import { ChartOptions, ChartType, ChartDataSets } from 'chart.js';
import { Color } from 'ng2-charts';

@Component({
  selector: 'app-bubble-chart',
  templateUrl: './bubble-chart.component.html',
  styleUrls: ['./bubble-chart.component.scss']
})
export class BubbleChartComponent implements OnInit {
  bubbleChartOptions: ChartOptions = {
    responsive: true,
    scales: {
      xAxes: [{
        ticks: {
          min: 0,
          max: 30,
        }
      }],
      yAxes: [{
        ticks: {
          min: 0,
          max: 30,
        }
      }]
    }
  };
  bubbleChartType: ChartType = 'bubble';
  bubbleChartLegend = true;

  bubbleChartData: ChartDataSets[] = [
    {
      data: [
        { x: 10, y: 10, r: 10 },
        { x: 15, y: 5, r: 15 },
        { x: 26, y: 12, r: 23 },
        { x: 7, y: 8, r: 8 },
      ],
      label: 'Series A',
    },
  ];

  constructor() { }
  ngOnInit(): void { }
}
02. edit the bubble-chart.component.html file and implement chart data
<div class="row">
  <div class="col-6 offset-3">
    <canvas baseChart
      [datasets]="bubbleChartData"
      [options]="bubbleChartOptions"
      [legend]="bubbleChartLegend"
      [chartType]="bubbleChartType">
    </canvas>
    <h3 class="text-center mt-3">Bubble Chart</h3>
  </div>
</div>
Scatter Chart example
01 . Edit the scatter-chart.component.ts file and implement chart data
import { Component, OnInit } from '@angular/core';
import { ChartDataSets, ChartType, ChartOptions } from 'chart.js';

@Component({
  selector: 'app-scatter-chart',
  templateUrl: './scatter-chart.component.html',
  styleUrls: ['./scatter-chart.component.scss']
})
export class ScatterChartComponent implements OnInit {
  scatterChartOptions: ChartOptions = {
    responsive: true,
  };
  scatterChartData: ChartDataSets[] = [
    {
      data: [
        { x: 1, y: 1 },
        { x: 2, y: 3 },
        { x: 3, y: -2 },
        { x: 4, y: 4 },
        { x: 5, y: -3, r: 20 },
      ],
      label: 'Series A',
      pointRadius: 10,
    },
  ];
  scatterChartType: ChartType = 'scatter';

  constructor() { }

  ngOnInit(): void {}
}
02. edit the scatter-chart.component.html file and implement chart data
<div class="row">
  <div class="col-6 offset-3">
    <canvas baseChart
      [datasets]="scatterChartData"
      [options]="scatterChartOptions"
      [chartType]="scatterChartType">
    </canvas>
    <h3 class="text-center mt-3">Scatter Chart</h3>
  </div>
</div>
Explore source code: https://github.com/techincent/angular-chart-example